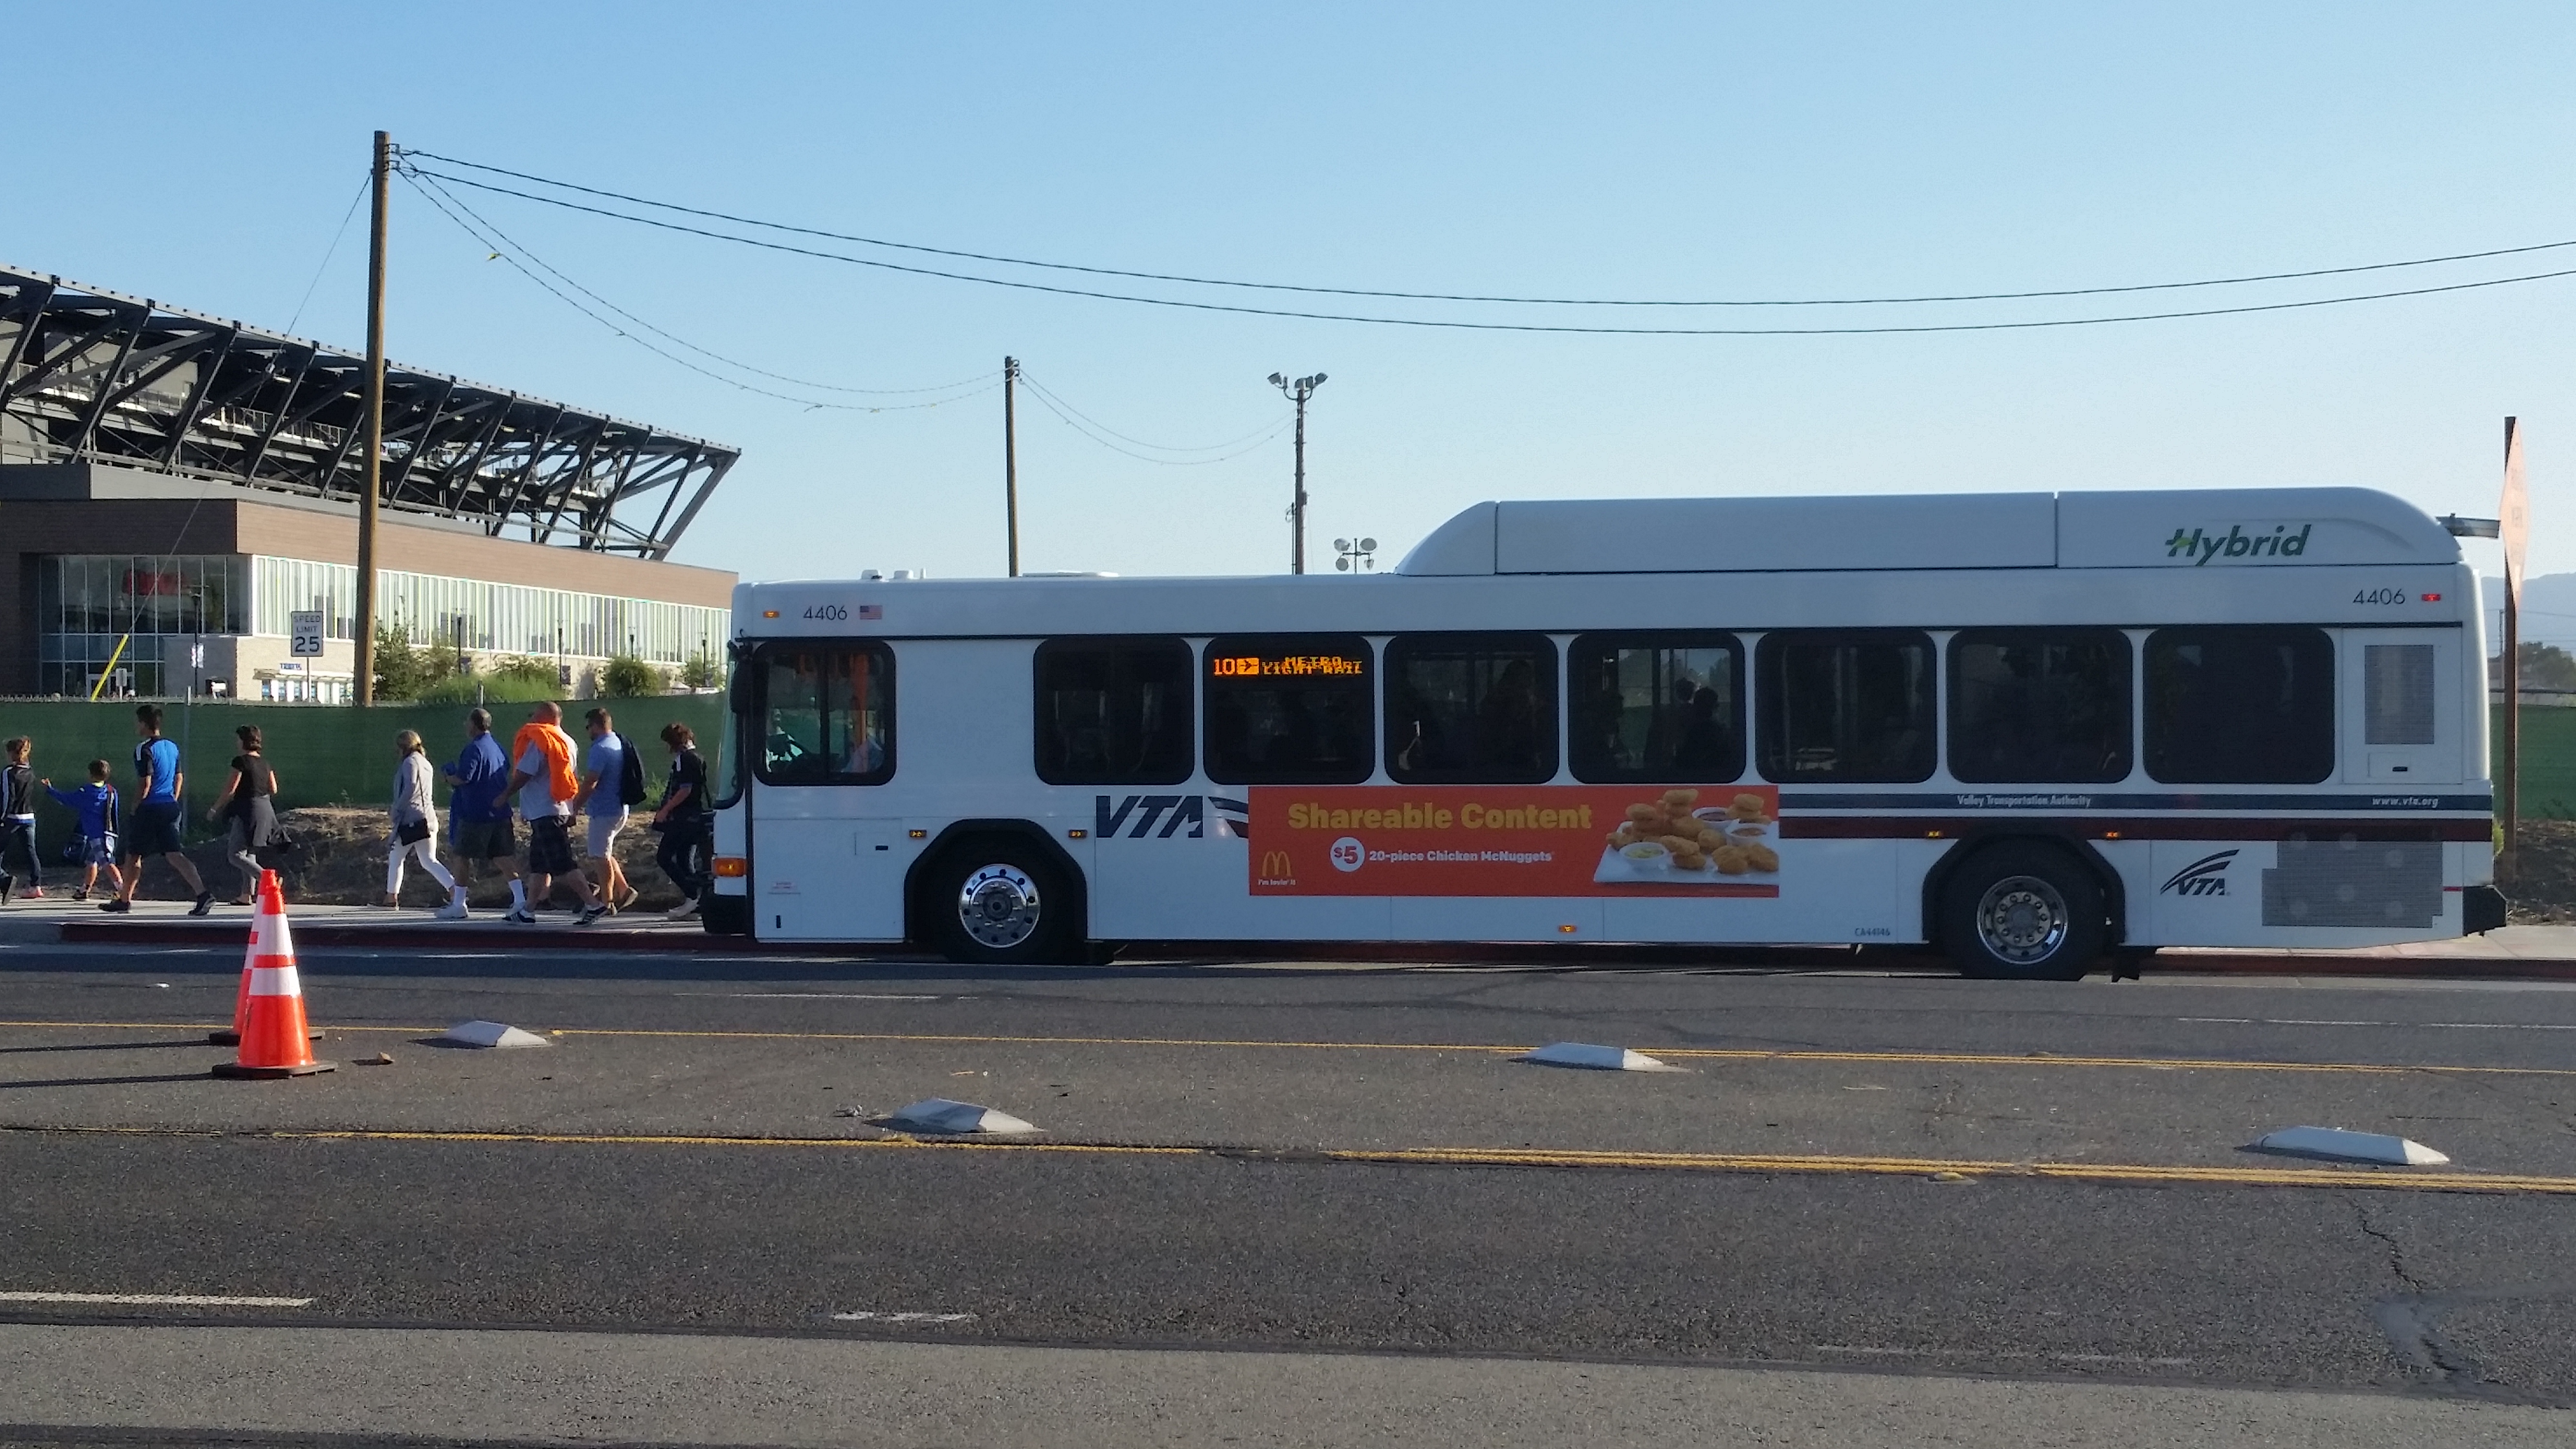
A bus ridership crisis at the Santa Clara Valley Transportation Authority (VTA) has publicly reared its head. Gary Richards of the San Jose Mercury News reports on how VTA bus ridership has dropped 23% since 2001. Richards’ report details highlights of a presentation from worldwide transit planner Jarrett Walker detailing solutions to the bus ridership crisis.
More details on that story, the report, and what YOU can do follow after the jump.
The Rest Of the Story
Gary Richards interviewed me on this story last week. Here is an email exchange with his inquiry for the story and my comments on the Walker Report.
One key fact that Richards’ story got wrong was the final cost of the Walker report. Here is how Richards’ story detailed the cost of the two-year report:
Currently, about 30 percent of VTA bus service is geared to covering areas where bus rides are vital to the very few riders those lines carry. The two-year, $50,000 report by consultant Jarrett Walker + Associates said if that was lowered to 20 percent or 10 percent and money was redirected to the most heavily used routes, ridership and fare revenues would likely increase.
An email to VTA’s Office of the Board Secretary revealed a final cost over 20% higher:
Question: How much did VTA spend in hiring Jarrett Walker & Associates last year?
VTA Staff Response: VTA paid $63,496.00 to Jarret Walker and Associates for work performed in calendar year 2015.
Question: In what portion of the budget did the expenditure originate from?
VTA Staff Response: The expenditures were paid from the VTA Transit Fund Operating Budget.
Recall the last time VTA reorganized its bus service, back in 2007. While it was supposed to make VTA more efficient and increase bus ridership, as of 2015 it still has nearly the same 106,000 riders it had as when the bus reorg took effect in 2008. VTA’s bus system statistics detail this fact, and are found below.
Besides higher fares and service reductions detailed in Richards’ article, one other factor should have been highlighted: spending priorities at VTA. A Palo Alto Daily Post article from May 2014 detailed how VTA spent your tax money from Measure A in 2000. According to that article, of the $1.4 billion in sales tax revenue raised by the 1/2-cent sales tax increase approved by County voters in 2000, only 2% of that amount ($29 million) went towards buses. While $235 million went towards VTA operating costs, the gist of the rest of the amount ($642 million) went towards bringing BART to San Jose.
A further breakdown of this budget – and prior VTA budgets – will be covered in a future article.
Educate Yourself More On This Issue
VTA’s true managers and financiers – Santa Clara County residents like YOU – need to read Jarrett Walker’s report below.
This will help you learn how land use decisions combined with transportation decisions created the bus ridership losses at VTA – with some alternatives. Also, read Jarrett Walker’s book Human Transit: How Clearer Thinking About Public Transit Can Enrich Our Communities and Our Lives at your favorite bookstore or library.
Also, read the 1-page document from VTA (from July 2015) about their bus system statistics. One thing worth noting in that fact sheet: Active bus and “peak bus” deployments countywide are about the same as they were in roughly 1997.
What’s Related To This Story?
- VTA Commute To De Anza Needs Improvement – La Voz News
- Green Caltrain blog post on Jarrett Walker’s report
- From SPUR: Shaping Our Transit Destiny – Four Questions For the South Bay
What Is the Issue?
VTA has lost 23% of its bus ridership since 2001. As a result, VTA will start the process for reorganizing its bus system for the first time since 2007. VTA will hold public meetings this summer to take your input on the proposed bus reorganization alternatives.
Meanwhile, what are your thoughts on what is going on with VTA bus ridership and proposed alternatives to turn it around? What are YOU willing to do to ensure VTA follows up and applies Jarrett Walker’s recommendations? Please discuss in the Comments section.
Who’s Responsible?
In Santa Clara County, the VTA Board of Directors makes the final decisions on paratransit, bus and light rail service, transit projects, and some highway projects. Here is their current list, and how to contact them by email or telephone.
Also, learn more about the activities of your city’s or town’s “Planning Commission.” Decisions on what is built – or not built – and where in your city also affect VTA ridership. Examples of this: the Apple “Spaceship” in Cupertino and a new parking garage in Morgan Hill.
It is past time for every Santa Clara County resident to hold VTA and other local officials accountable for this and all transit issues. Let’s get going NOW.
Eugene Bradley
Founder, Silicon Valley Transit Users
Is the decline concentrated on particular routes or across the board?
Take a look at VTA’s measure A website.
http://www.vta.org/projects-and-programs/programs/2000-measure-a-transit-improvement-program
Measure A, you’ll recall, is the .5 cent sales tax we all pay in order to fund transit improvements. One of the eligible uses for Measure A sales tax revenues is “Funding operating and maintenance costs for increased bus, rail and paratransit services.”
Unfortunately, in reality, all of the Measure A money is going down the BART sinkhole. It wasn’t enough so we had to pass another tax, the 2008 Measure B. That STILL isn’t enough and we’ll face another sales tax proposition on the November ballot.
Vote NO.
Hi Eugene,
I just wanted to clarify the comment about funding spent on Jarrett Walker and Associates. VTA’s contract with Jarrett Walker has multiple components, one of which was the independent assessment of current transit service. The deliverable for that task was the Transit Choices Report and that cost $50,000. Jarrett has also been asked to work on other tasks such as research, meeting with elected officials, developing policy recommendations, leading workshops and designing a draft network plan. Your question to VTA about funds spent on Jarrett Walker and Associates pertained specifically to work performed in the 2015 calendar year and was not limited to the specific task of the independent assessment. So, your number ($63,496) is accurate for the 2015 calendar year. Gary’s number of $50,000 is accurate for the specific task of the independent assessment.
Adam Burger
Senior Transportation Planner, VTA